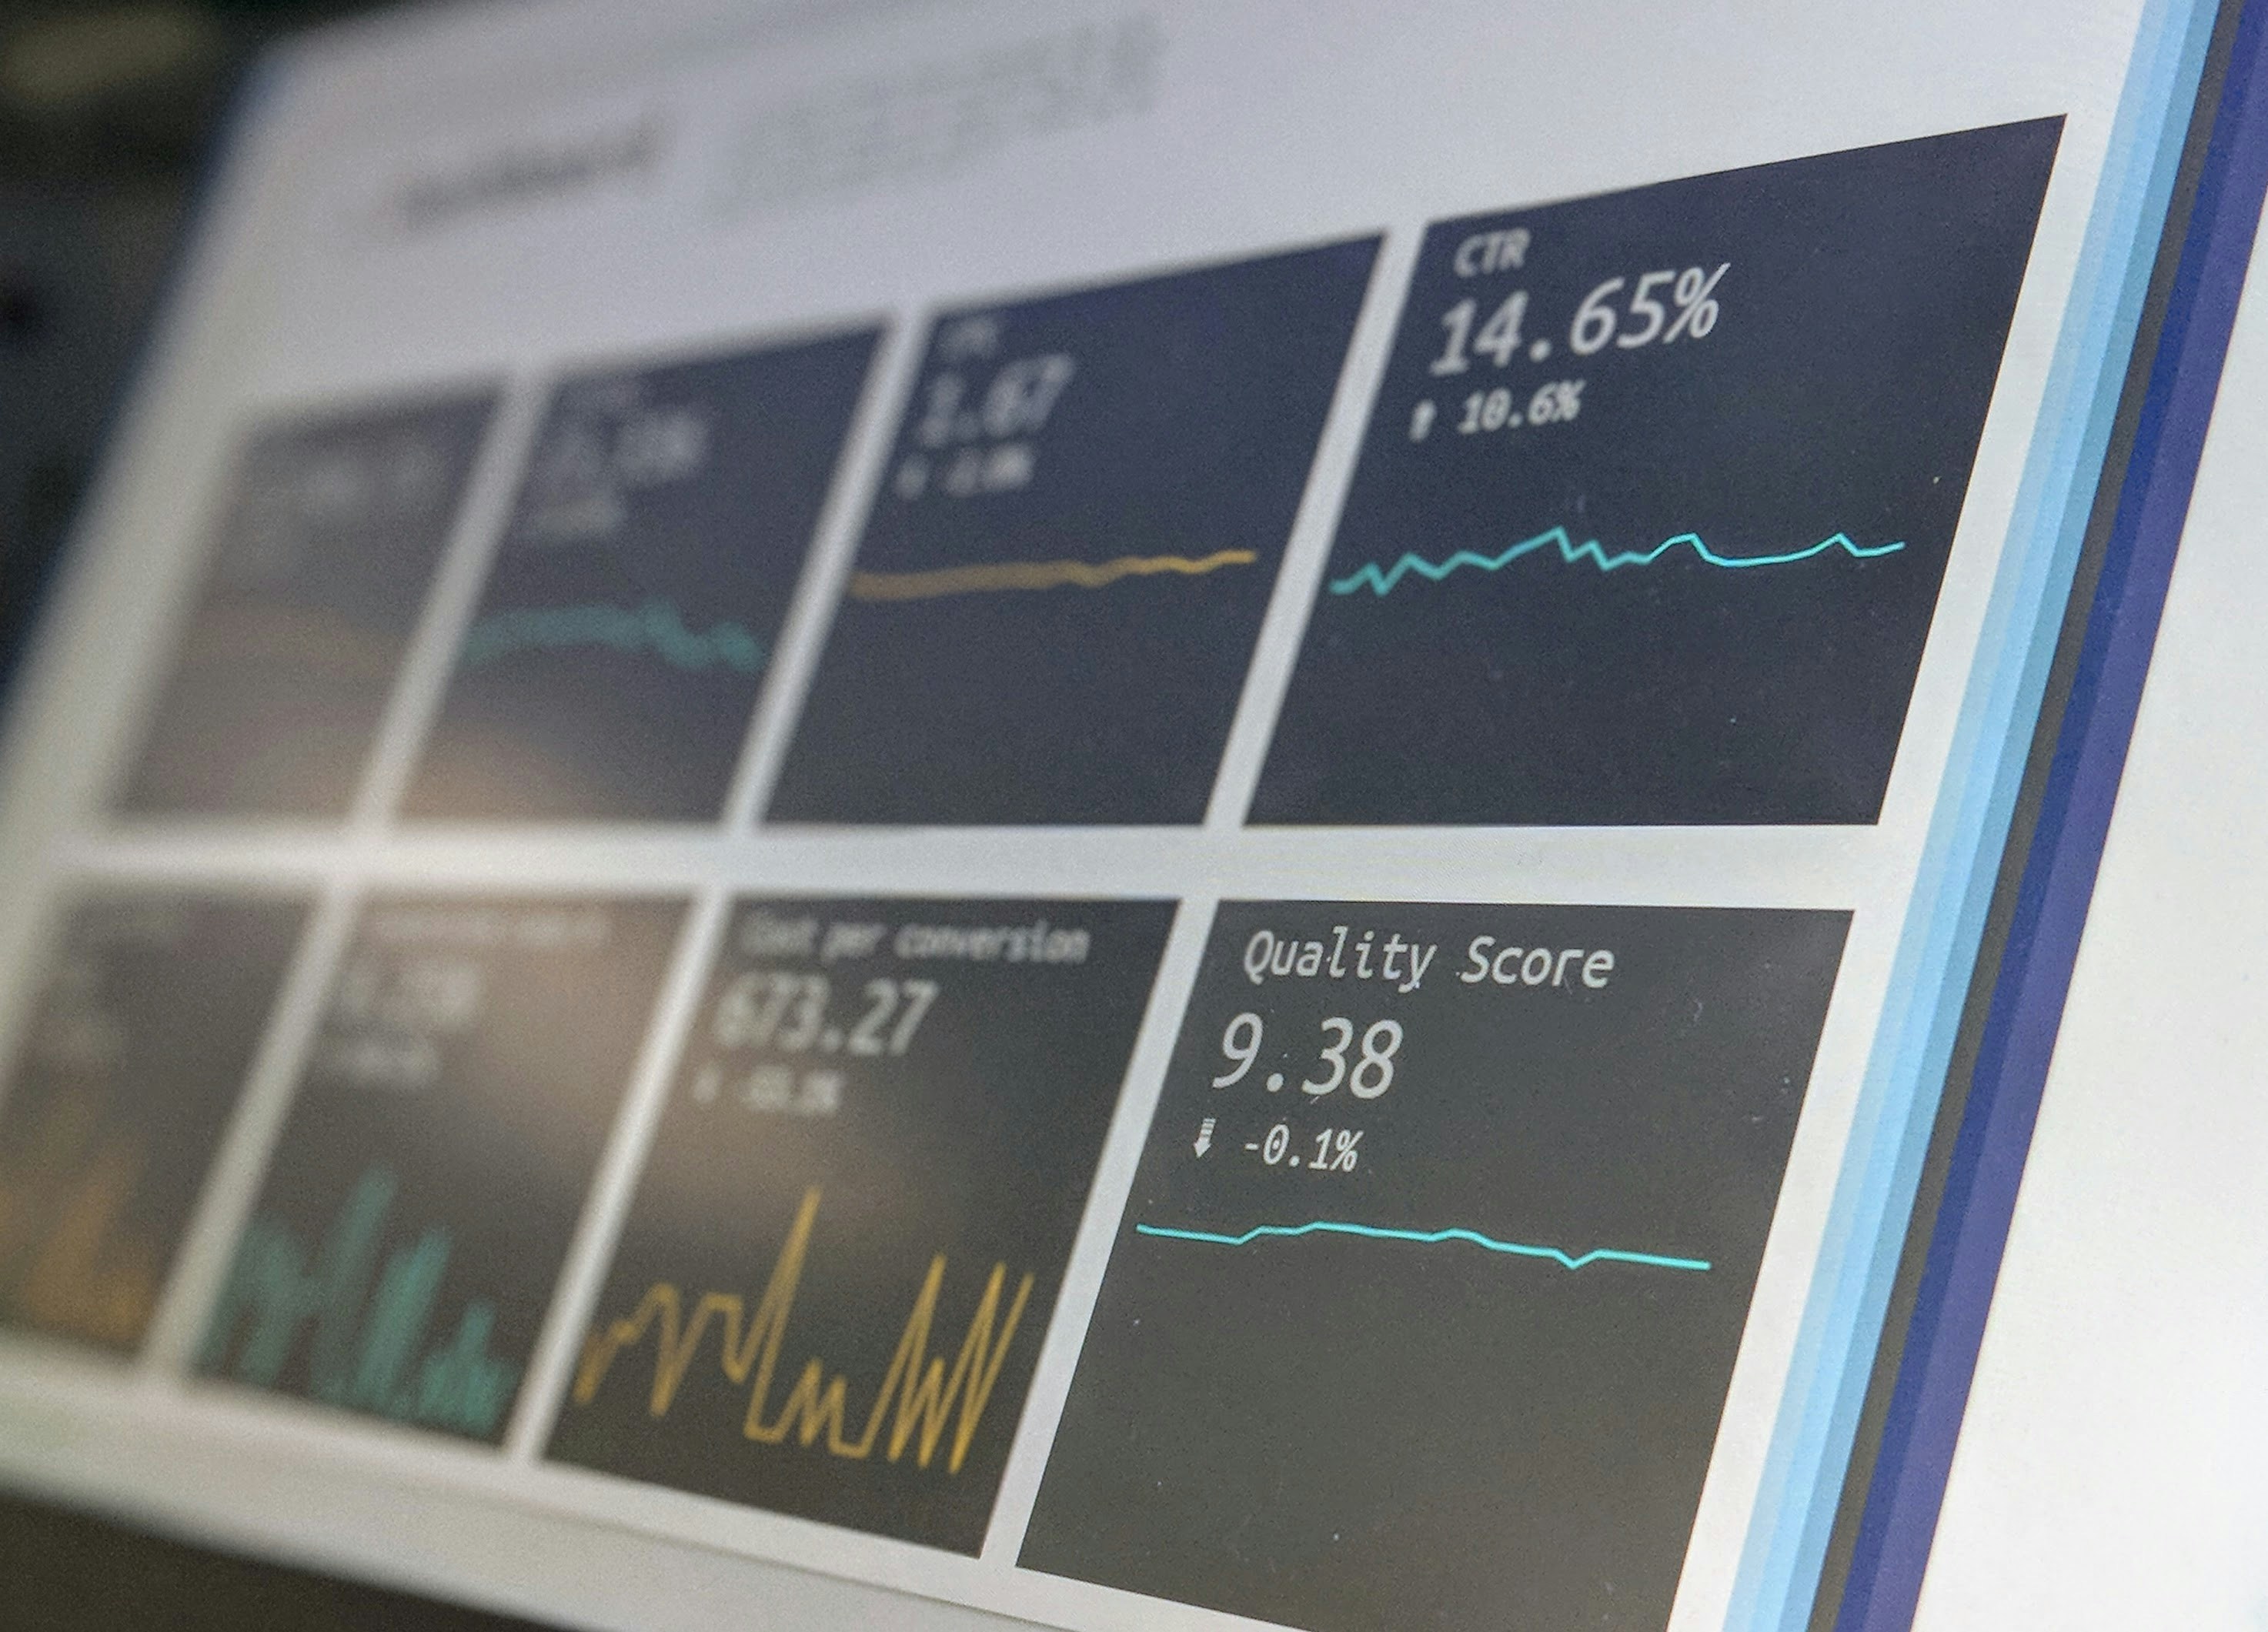
Marketing dashboard: KPIs to track and how to build one

Why a marketing dashboard should drive decisions, not decorate slides
Many dashboards look impressive but do not change what the team does next. A useful dashboard is short, comparable month to month, and tied to outcomes. It helps a founder or marketing lead decide continue, scale, fix, or stop without a long meeting.
This guide shows you which KPIs to track, how to define them, and how to build a one-page dashboard your team will actually use.
The five KPI categories that keep you honest
- Awareness. Directional reach and quality signals, for example branded search volume or qualified reach.
- Acquisition. High intent leads or qualified inbound opportunities.
- Conversion. Lead to opportunity rate and opportunity to win rate, or checkout conversion.
- Retention and value. Repeat purchase rate, active subscribers, gross revenue retention.
- Efficiency. Cost per opportunity, CAC payback, or marketing spend as a percentage of revenue.
For a ready made structure, use build a marketing scorecard.
Step-by-step: build a one-page marketing dashboard
- Pick one KPI per category. More is noise. Choose the best available leading indicator for your goal.
- Write definitions. Exact formula, data source, refresh cadence, and the owner who writes the monthly action.
- Set targets and thresholds. Target plus green, amber, red bands to remove debate.
- Make it comparable. Show last month, this month, and a three month trend so patterns emerge.
- Add one insight and one action per KPI. Reporting must produce the next step.
Definitions that teams can trust
- Keep formulas plain. For example, Lead to opportunity rate = opportunities created from marketing sourced leads / total marketing sourced leads.
- Document attribution windows and channel groupings. Note known gaps.
- Audit tracking monthly. Forms, UTMs, and key events fail silently without checks.
To put definitions that teams can trust into practice, use the steps above: clarify the outcome, choose 1–3 channels, set a test budget, and track weekly so you can double down on what works.
Attribution that is good enough to decide
Perfect attribution is rare. You do not need it to make progress. Combine three lenses.
- Platform reporting for directional channel checks.
- CRM sourced revenue for truth.
- Tests and holdouts for causal signals when volume allows.
Keep the method stable within the quarter. Record assumptions on the dashboard so debates shrink.
Visual layout leaders read
- Landscape one page. Five KPI rows with columns for target, result, three month trend, insight, and action.
- Traffic light status tied to thresholds, not gut feel.
- Owner names on the page so accountability is visible.
Run the dashboard inside your operating rhythm
Use the dashboard in your weekly standup for a quick pulse and in a monthly review for decisions. Decide continue, scale, fix, or stop using the thresholds you agreed. For cadence details, read build a simple marketing operating rhythm.
If you are turning strategy into a quarterly plan, pair this with marketing roadmap, quarterly planning template and keep the big picture clear with one page marketing strategy.
Common dashboard pitfalls to avoid
- Too many charts. Five KPIs with actions beat a 20 page deck.
- Lagging indicators only. Add at least one leading signal you can influence.
- Changing definitions mid quarter. Update only at the quarterly reset and record changes.
- No owner names. Every KPI needs one person who writes the action.
Final checklist
- Five KPIs chosen, one per category.
- Definitions, sources, cadence, and owners written.
- Targets and thresholds set.
- Three month trend visible.
- One insight and one action per KPI.
- Dashboard used in weekly and monthly cadence.
Marie Uhart
Marie works with founders and lean teams who need senior marketing leadership and hands-on support without hiring full-time. As a fractional CMO, she helps B2B and B2C companies strengthen their brand foundations, drive sustainable growth, and expand into new markets with confidence.
Alongside her consulting work, Marie supports business and marketing professionals through career transitions and trains marketing teams to use AI tools confidently in their day-to-day work.

Related articles
